Project Description
Welkin Course Codes: CPC6

Course Features
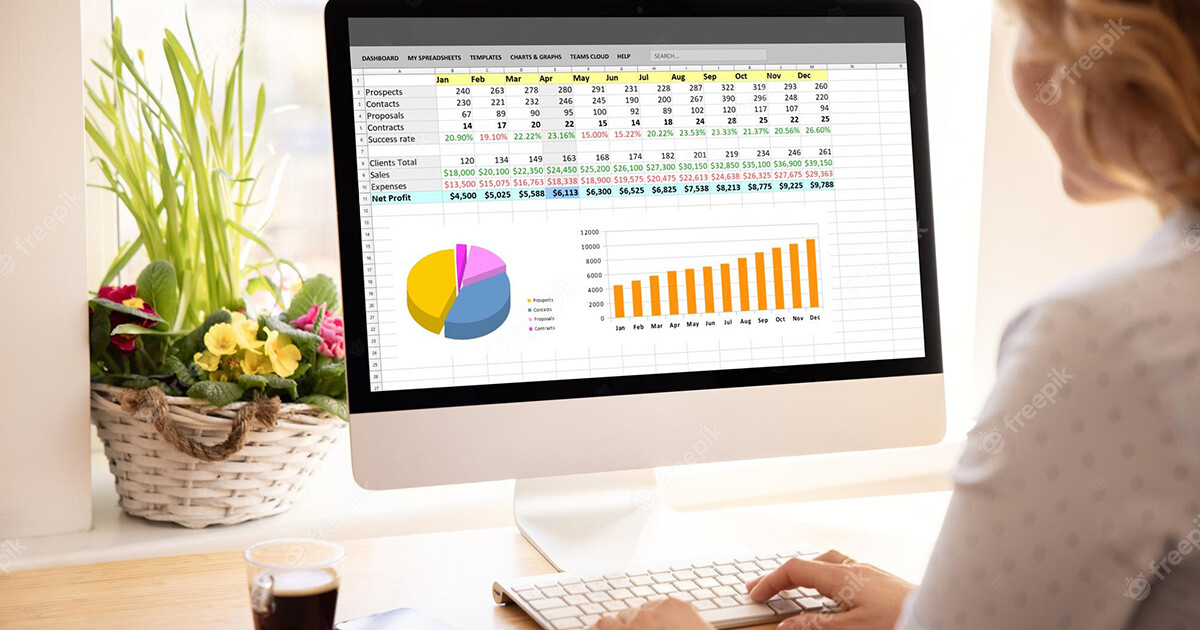
Microsoft Excel is a convenient and powerful tool to create charts. The graphical nature of a chart attracts attention and help readers understand data trends and analyses better. This course demonstrates how data can be communicated and visualized effectively through the use of charts. Course topics include:
- Basic charts creation and their types
- Chart formats and modifications
- Chart designs and templates
- Qualified and experienced instructors
- Easy-to-follow, step-by-step hands-on learning approach
- Best practices explained and demonstrated
Learn from the Experts

Get Your Skills Certified

Certify your Excel skills with Microsoft Office Specialist Excel certification. The certification is not a requirement for course completion but we highly recommend you to get your skills professionally recognized.
Remark: The course fee does not include the certification exam.
Further Study
Course Fee
$600
Course Duration
3 Hours
Course Prerequisites
Course participants should have a basic knowledge of Microsoft Excel.
Title of Award
Upon successful completion of the course, students will receive a Certificate of Achievement.
Sign up for your course by clicking the Enrol button and proceed to Checkout to finish course registration.
Course No. 課程編號 | Info. 語言/系統/地點 | Start 開課日 | End 完課日 | Day(s) 上課日 | Time 上課時段 | Duration 課程長度 | Enrol 報名 | |
---|---|---|---|---|---|---|---|---|
CPC6-20011K | Cantonese / PC / MongKok | 14/01 | 14/01 | TUE | 0930-1230 | 3 hours / 1 sessions | 20200114 | $600Enrol |
CPC6-20051K | Cantonese / PC / MongKok | 19/05 | 19/05 | TUE | 0930-1230 | 3 hours / 1 sessions | 20200519 | $600Enrol |
CPC6-20091K | Cantonese / PC / MongKok | 16/09 | 16/09 | WED | 0930-1230 | 3 hours / 1 sessions | 20200916 | $600Enrol |
A chart is a powerful tool to graphically present the results of data analysis or market trends. This course is specially designed for those who want to master Excel’s chart creation features. Completing the course will enable you to create different types of charts and use a variety of techniques to build charts with a professional look. You will also learn how to make use of multiple combination charts to enhance data presentation effectiveness.
- Building Charts with Excel
- An Overview of Excel Charting
- Creating Charts with the Chart Wizard
- Excel Chart Types
- Printing Charts
- Troubleshooting
- Excel in Practice
- Modifying Excel Charts
- Options for Improving Your Charts
- Changing the Chart Type
- Changing a Data Series
- Adding a Secondary Axis to the Chart
- Value Axis Scaling
- Category Axis Scaling
- Changing the Series Order
- Adding a Trendline to a Data Series
- Troubleshooting
- Excel in Practice
- Formatting Charts
- An Overview of Formatting Charts
- Formatting Lines: Axes, Tick Marks, High/Low Lines, and Error Bars
- Formatting Text: Data Labels, Titles, Legends, and Text Boxes
- Enhancing Charts with Shapes
- Formatting Data Series
- Changing the Border, Color, or Fill of a Chart Item
- Formatting 3D Charts
- Troubleshooting
- Excel in Practice
- Professional Charting Techniques
- Formatting Charts for a Professional Look
- Creating Column Depth
- Pie Chart Techniques
- Using Fill Effects to Show Variance in 3D Charts
- Using Form Controls with Charts
- Stacking Multiple Charts
- Creating Cost and Production Curves with Charts for Variance
- Linking Chart Text to Worksheet Cells
- Charting Hidden Data
- Creating Effective Multiple-Combination Charts
- Building Charts with Excel
- An Overview of Excel Charting
- Creating Charts with the Chart Wizard
- Excel Chart Types
- Printing Charts
- Troubleshooting
- Excel in Practice
- Modifying Excel Charts
- Options for Improving Your Charts
- Changing the Chart Type
- Changing a Data Series
- Adding a Secondary Axis to the Chart
- Value Axis Scaling
- Category Axis Scaling
- Changing the Series Order
- Adding a Trendline to a Data Series
- Troubleshooting
- Excel in Practice
- Formatting Charts
- An Overview of Formatting Charts
- Formatting Lines: Axes, Tick Marks, High/Low Lines, and Error Bars
- Formatting Text: Data Labels, Titles, Legends, and Text Boxes
- Enhancing Charts with Shapes
- Formatting Data Series
- Changing the Border, Color, or Fill of a Chart Item
- Formatting 3D Charts
- Troubleshooting
- Excel in Practice
- Creating Chart
- Column Chart
- Bar Chart
- Line Chart
- Bar Chart
- Radar Chart
- XY Scatter
- Others
- Professional Charting Techniques
- Formatting Charts for a Professional Look
- Creating Column Depth
- Pie Chart Techniques
- Using Fill Effects to Show Variance in 3D Charts
- Using Form Controls with Charts
- Stacking Multiple Charts
- Creating Cost and Production Curves with Charts for Variance
- Linking Chart Text to Worksheet Cells
- Charting Hidden Data
- Creating Effective Multiple-Combination Charts
- You can enrol this course by our online system, or call (852) 3605 3322 for reservation.